Sometimes we need some features which are not available in default library plugins. At that time we need to do some customization in the library to fulfill our requirements. In this article I’m going to show you several dc.js customization specific to the bubble chart. There are number of chart libraries available over the net. Among those d3.js is the most popular and powerful open source library for any kind of data visualization. dc.js is a multi-dimensional charting library built to work natively with crossfilter and rendered using d3.js.
Below are some of the customizations in Bubble Chart of dc.js :
Colouring bubbles with matching tooltip :
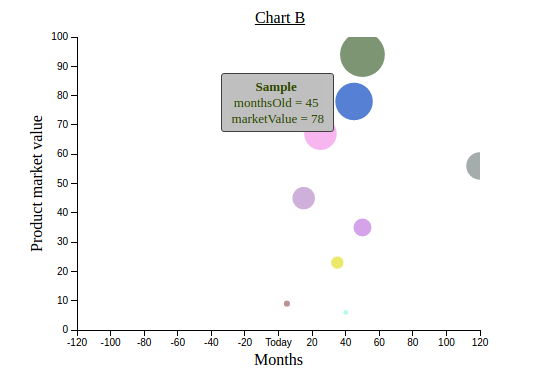
We have to customize chart in such a requirement where we need to apply color on bubbles based on specific field, i.e. title, market value, etc. You can see customized chart B where bubble color is based on product title. You can also show tooltip as per your requirement on bubble hover which represent product. You can also set the color of tooltip as per your needs.
Bubbles with coloring border and matching tooltip :
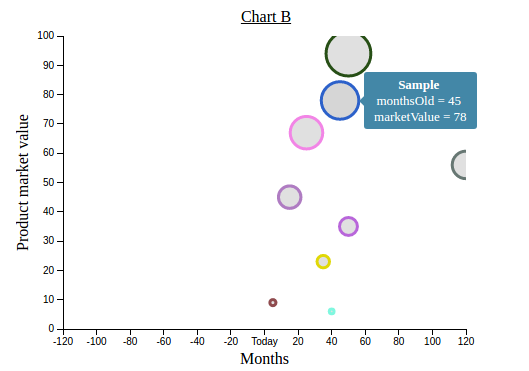
We can show bubbles with colorful border based on specific field/data, you can see this in chart B.
Inverting bubble position :
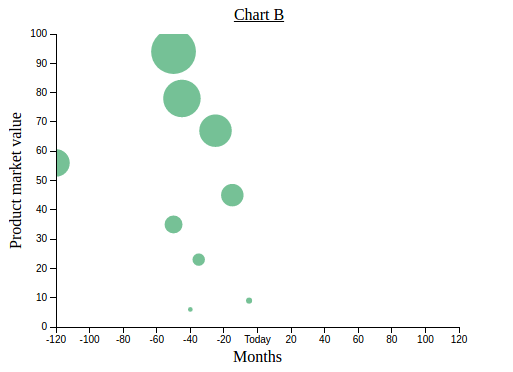
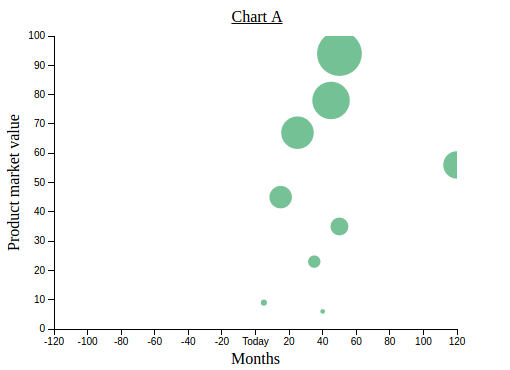
By default bubbles are display at the positive side of x axis as displayed in chart A. Here I have customized it to display bubbles on reverse side without changing x axis order, you can see this in chart B.
Zooming in descending order of x axis :
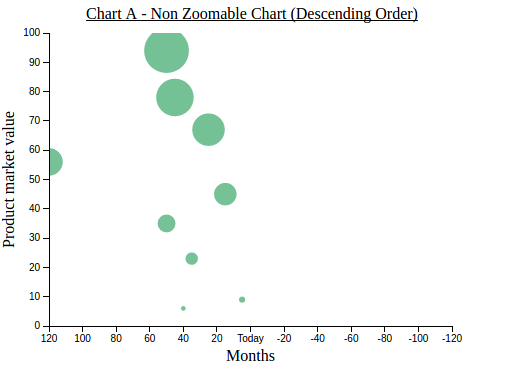
By default bubble chart is zoomable in ascending order (i.e. -2, -1, 0, 1 ,2) of x axis, but If we change x axis order to descending, chart is not zoomable i.e chart A. Here, I have customized it to make a chart zoomable in descending order(i.e. 2, 1, 0, -1, -2) of the x axis, you can see this in bubble chart B.
There are many more customization/enhancement possible in chart library. In this article you can see only dc.js library bubble chart customization. We can help you out if you want to customize or enhance in any chart library as needed.
For professional paid support, you may contact us at
[email protected]
.
