Happy to Connect, Let’s talk.
DXP | ERP | E-Commerce | AI-ML | DevOps | Bespoke Solutions
Trusted By
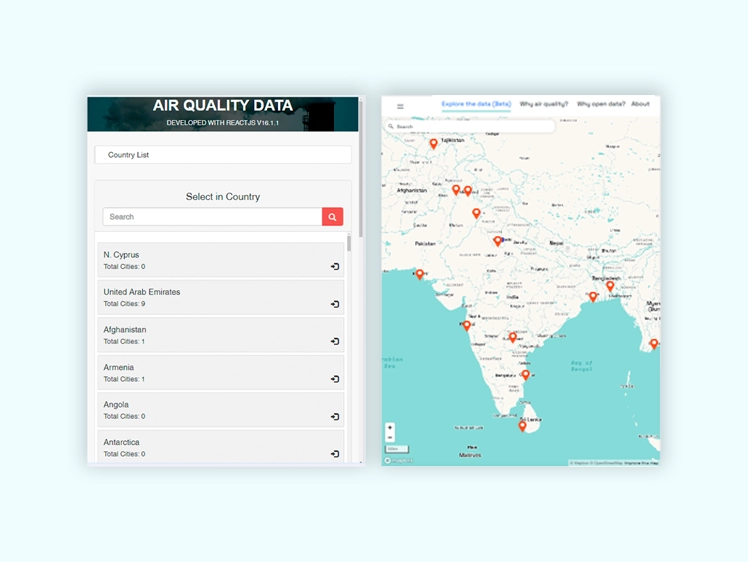
Air Quality Indicator Dashboard using React JS Frameworks
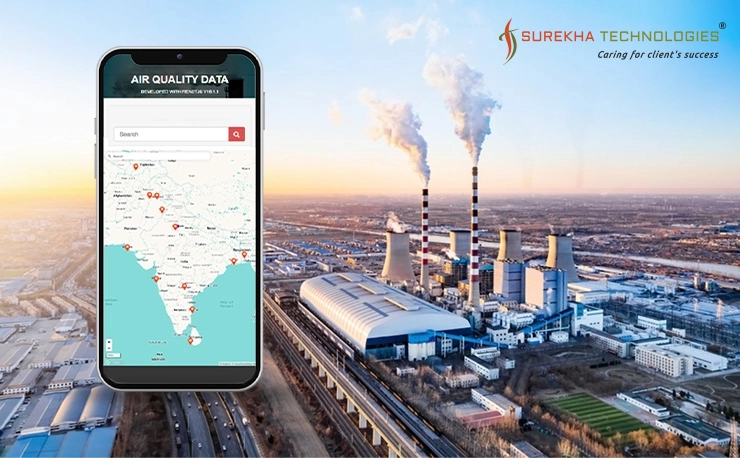
Our client, an environmental consultancy dedicated to reducing emissions and enhancing public health, needed a solution to efficiently collect and visualize Air Quality Index (AQI) data from multiple sources globally.
We developed an intuitive dashboard using ReactJS, which integrated real-time AQI data and provided data-driven insights. This solution allowed for comprehensive monitoring, analysis, and visualization of AQI levels, overcoming previous challenges related to data collection, real-time tracking, and trend analysis .
- Number of Employees : 125+
Project Brief
Our client is an environmental consultancy and service provider that helps businesses and communities in achieving cleaner air through effective emissions reduction strategies.
Since its establishment in 2007, they have expanded their team to include 125 environmental experts. With a focus on enhancing public health and enabling real-time data visualization, our client seeks an intuitive dashboard capable of retrieving and displaying AQI data.
Business Needs & Challenges
Technology Stack & Tools


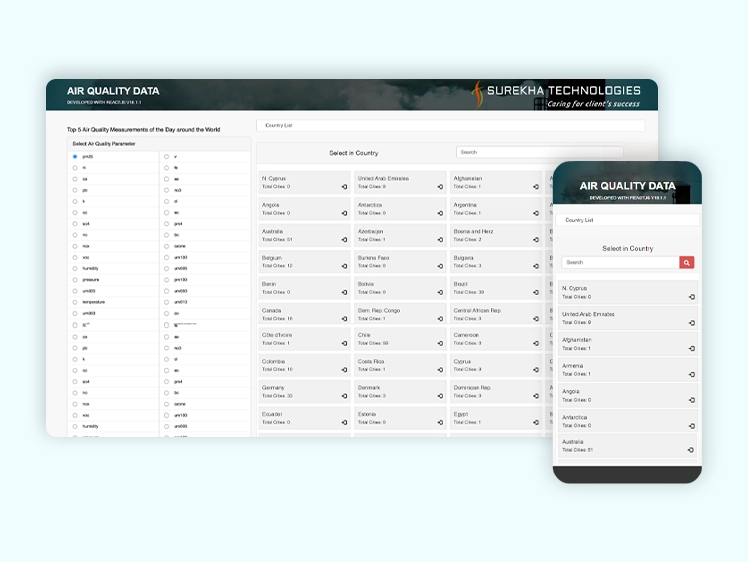
Implementation Overview
Business impacts
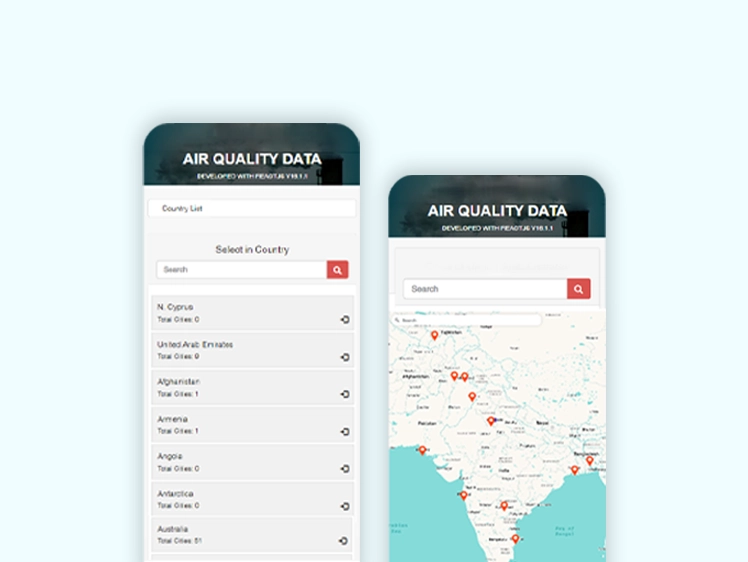
The client and their users can access air quality data in real-time.
Real-time AQI data facilitated data-driven decision-making for the client regarding outdoor activities, health precautions, and environmental policies.
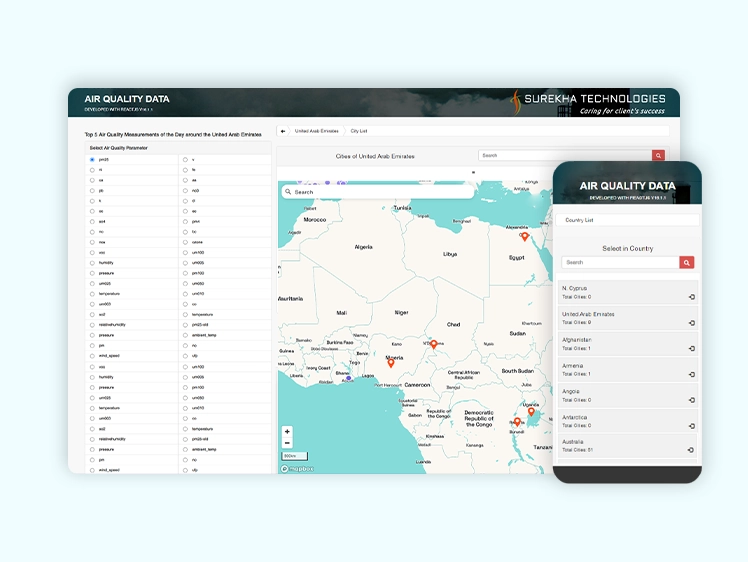
Our solution enabled the client to access pollution levels through interactive maps and intuitive reports, thereby making targeted emissions reduction strategies and promoting cleaner air for healthier living environments.
With API integration, the client can analyze AQI, identify pollution sources, and predict trends, enabling them to implement improvement strategies and enhance air quality.
Happy to Connect, Let’s talk.
DXP | ERP | E-Commerce | AI-ML | DevOps | Bespoke Solutions
Trusted By
201, 3rd Eye II, Nr. Panchvati Circle, CG Road, Ahmedabad
+91 79 40050848