Introduction
When running a business, numbers speak louder than words. But if those numbers are buried deep inside spreadsheets or reports you can’t tweak, their value gets lost. That’s why Odoo has invested heavily into its reporting framework: to give you powerful, no-code accounting reports in Odoo that adapt to your needs.
Think of it like this: instead of asking your IT team every time you need a slightly different view of your balance sheet, you can shape the reports yourself. Whether you’re a CFO fine-tuning a tax declaration, or an accountant grouping sales by team, Odoo gives you the flexibility to do it in just a few clicks.
In this blog, let’s explore how Odoo’s reporting engine works and how you can build your own reports step by step just like you’d expect from modern business software that adapts to you, not the other way around.
Core Elements and their configurations
Before jumping into building, let’s understand the building blocks. Odoo reporting is like LEGO: you get pieces (reports, lines, expressions, columns) that you can combine in different ways.
Here are the key concepts you should know:
Imagine you run a global company. You create a Generic Tax Report as a root report. Your French and US subsidiaries will both use this same root as a base, but apply their own local tax rules as variants.
Your Belgian company needs a VAT Report (BE) that follows Belgian tax regulations. Instead of building from scratch, you simply create a variant of the Generic Tax Report. This maintains consistency across your group but adapts to local compliance.
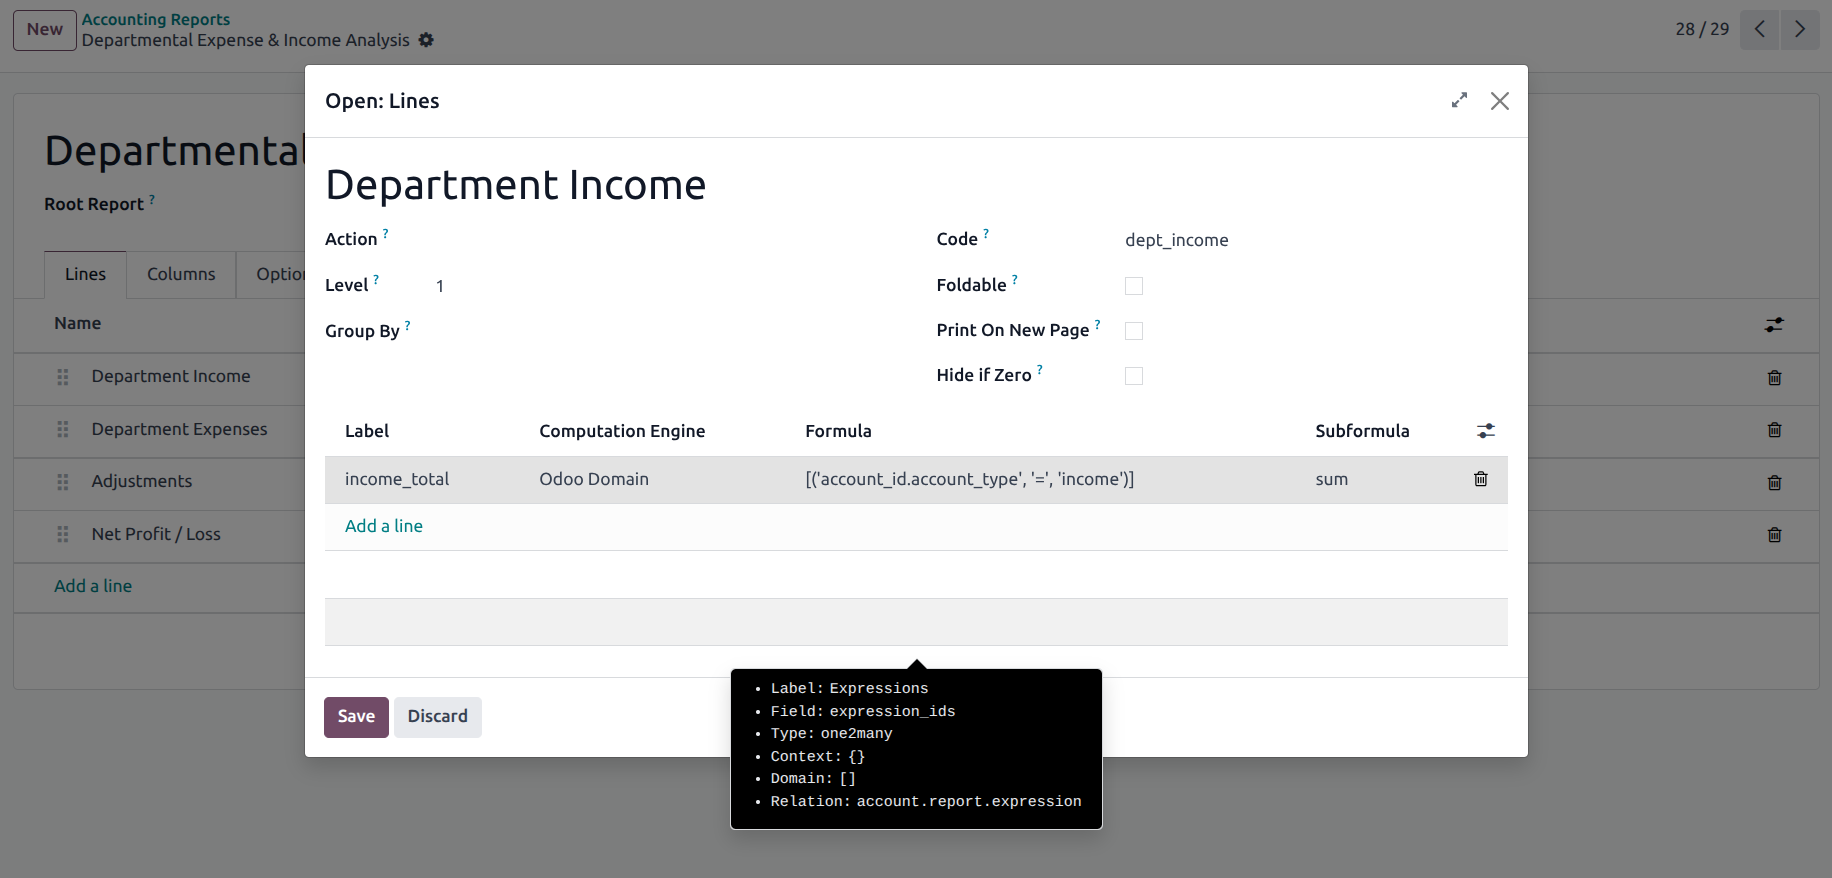
Lines – Every report is made of lines. Each line represents a value you want to display, like Revenue, Expenses, or Adjustments.
In a Profit & Loss report, you add a line called Marketing Expenses to track all advertising costs separately. This gives your CEO immediate insight into how much is being spent to acquire customers.
For the line Revenue, you add an expression that sums all journal items with the account prefix “70”. That way, any time revenue is booked, it’s automatically reflected here — no manual work needed.
Computation Engines – Odoo offers different ways to calculate numbers:
You want to show all sales invoices that are still unpaid → Domain engine filters move_type = 'out_invoice' and payment_state != 'paid'.
For Belgian VAT, the formula 21 automatically pulls lines tagged with +21% VAT and subtracts lines tagged with -21%.
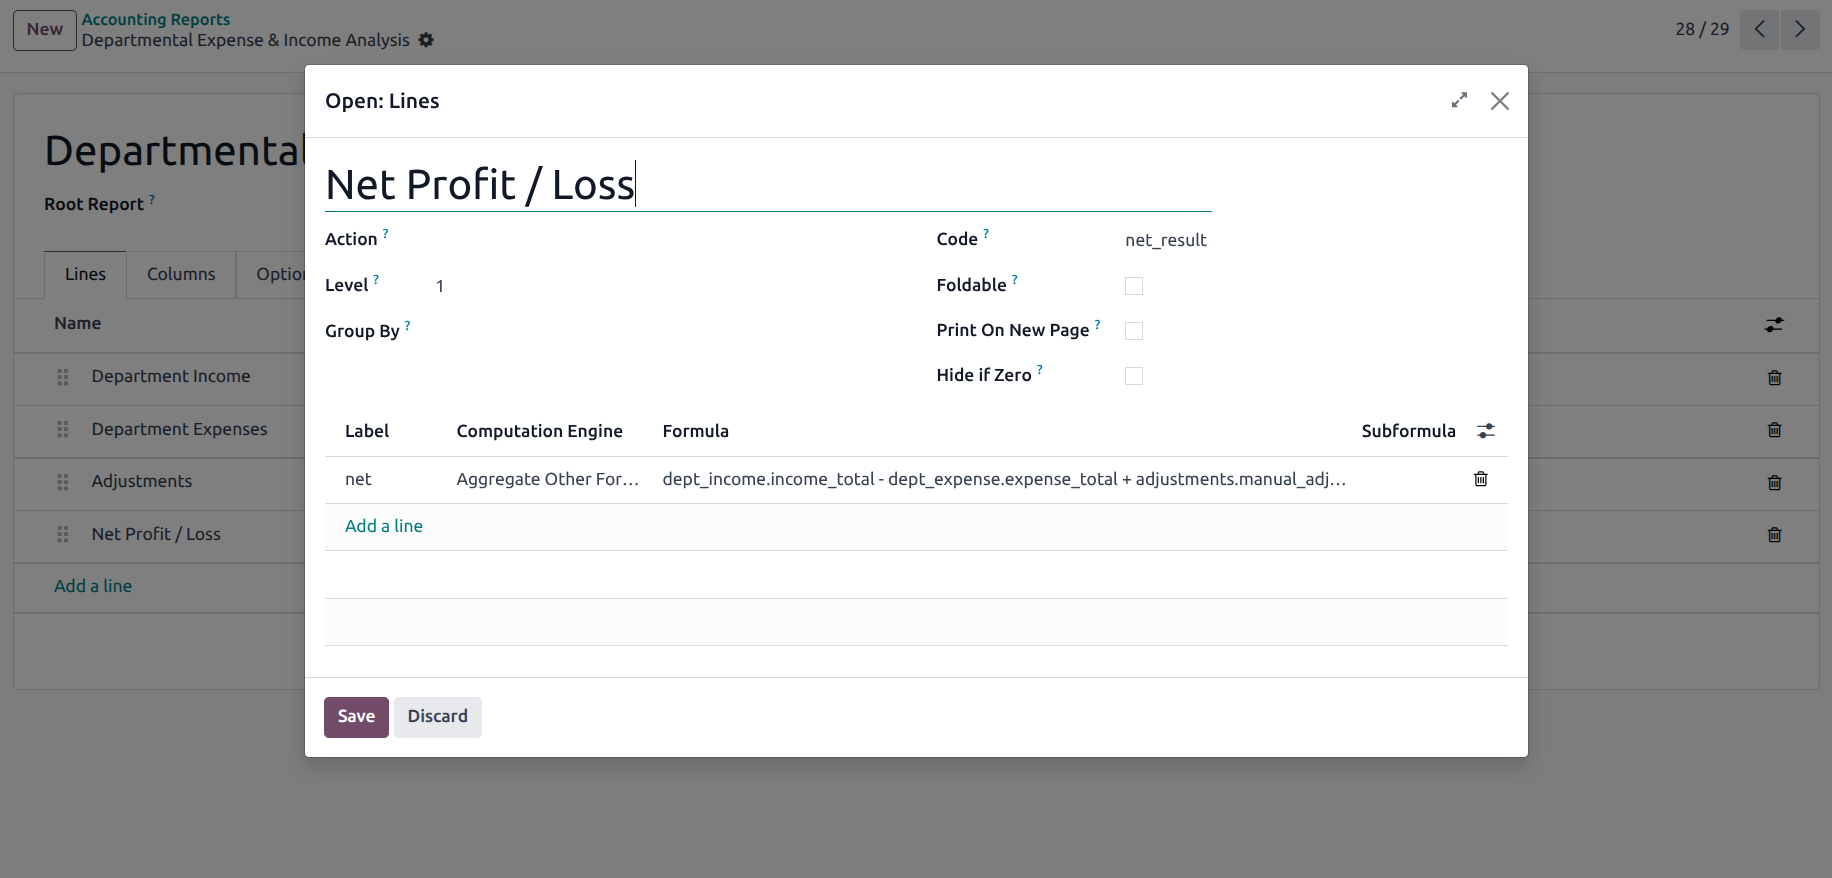
You define Gross Profit = Revenue – Cost of Goods Sold by simply referencing the two lines.
In a European chart, all asset accounts start with “1”. So, creating a Total Assets line with formula 1 instantly covers the whole group.
At year-end, you need to add a Statutory Adjustment value your auditor gave you. With an editable external value, you can key it in directly.
Suppose your industry has a regulation requiring a custom calculation of Carbon Credits per sale. Your dev team can plug in a Python function to compute this line.
Columns – Reports can display multiple periods, comparisons, or measures by defining columns.
In a cash flow report, you create three columns: This Month, Previous Month, and Change (%). In one glance, management sees not only the totals, but also the trend.
Grouping – Instead of a flat list of numbers, you can group lines by analytic accounts, sales teams, or other fields.
Your sales director wants to see revenue split by sales team. You add grouping on analytic_account_id, and suddenly the P&L breaks down team by team — perfect for performance reviews
For consolidating and other features of Custom Reports you can look into Odoo’s official document “https://www.odoo.com/documentation/18.0/applications/finance/accounting/reporting/customize.html”
Example Walkthrough: Building a “Departmental Expense & Income Analysis” Report
We want to track income and expenses by department (Marketing, R&D, Sales, etc.) using analytic accounts. The report will show:
Step 1: Create a New Root Report
Create a new report in Accounting → Configuration → Accounting Reports, name it Departmental Expense & Income Analysis, and add it to the menu. This is the first step in building custom accounting reports in Odoo.
Step 2: Group by Department
Use the built-in field analytic_account_id so results are grouped by department.
Step 3: Add Report Lines


Step 4: Add Columns
Define four columns: Income, Expenses, Adjustments, Net Result (All fields monetary type) in the column section which is next to Line section
Final Report View
Click on the Cog menu and then go for “Create Menu Item” you will notice that in the Reporting section at the last you’ll have your customized report “Departmental Expense & Income Analysis” click on it and see the result, which would look like this,
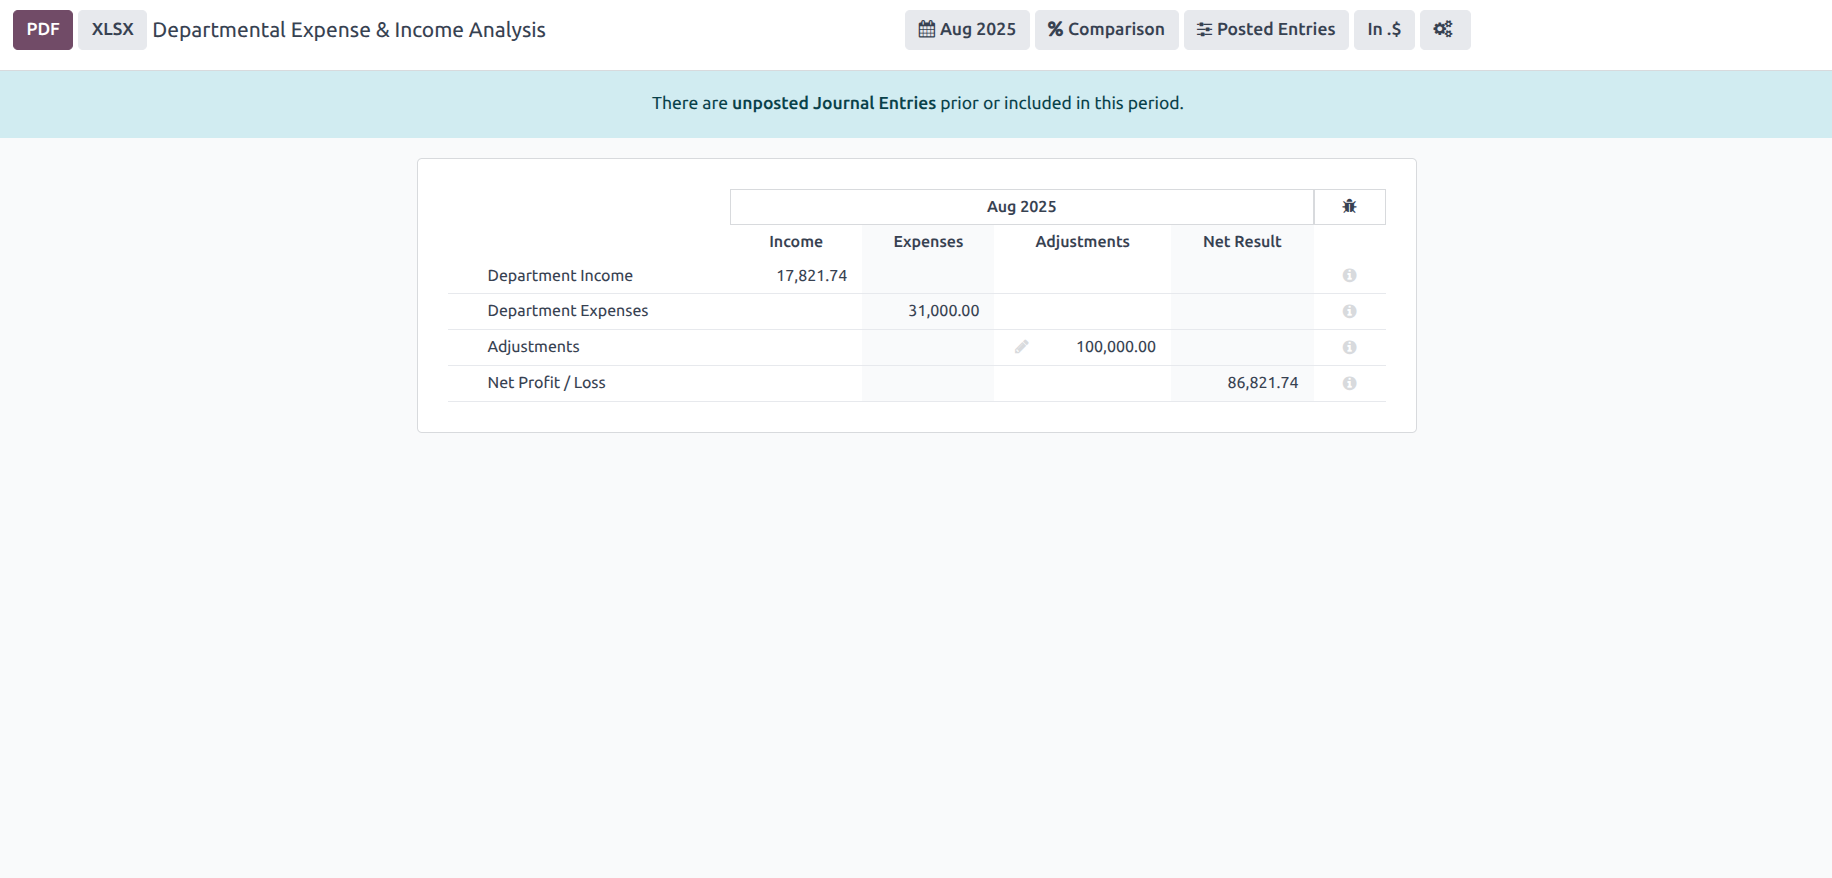
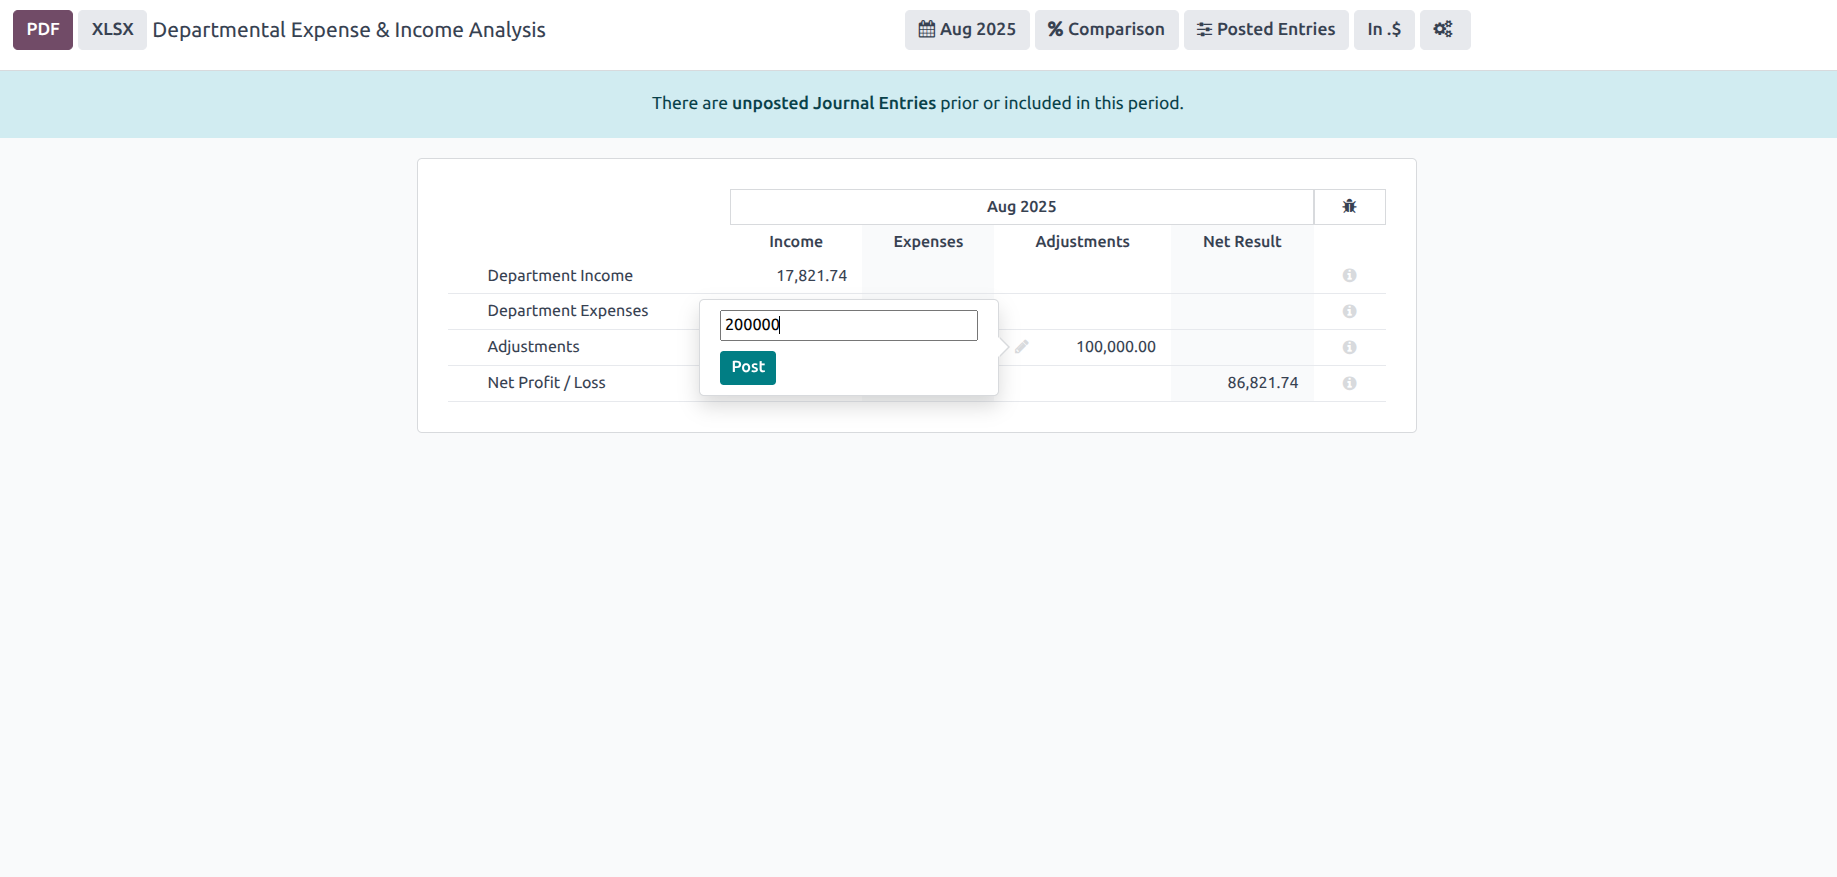
We can see the total income with formulas as well as the four columns we added are perfectly visible in the report, from here you can download it, customize it as well as the third field of Adjustment, you can write your own values by clicking on edit icon. This is the beauty of Odoo Custom Reports.
Try It Yourself (Mini Task for Readers)
Now it’s your turn!
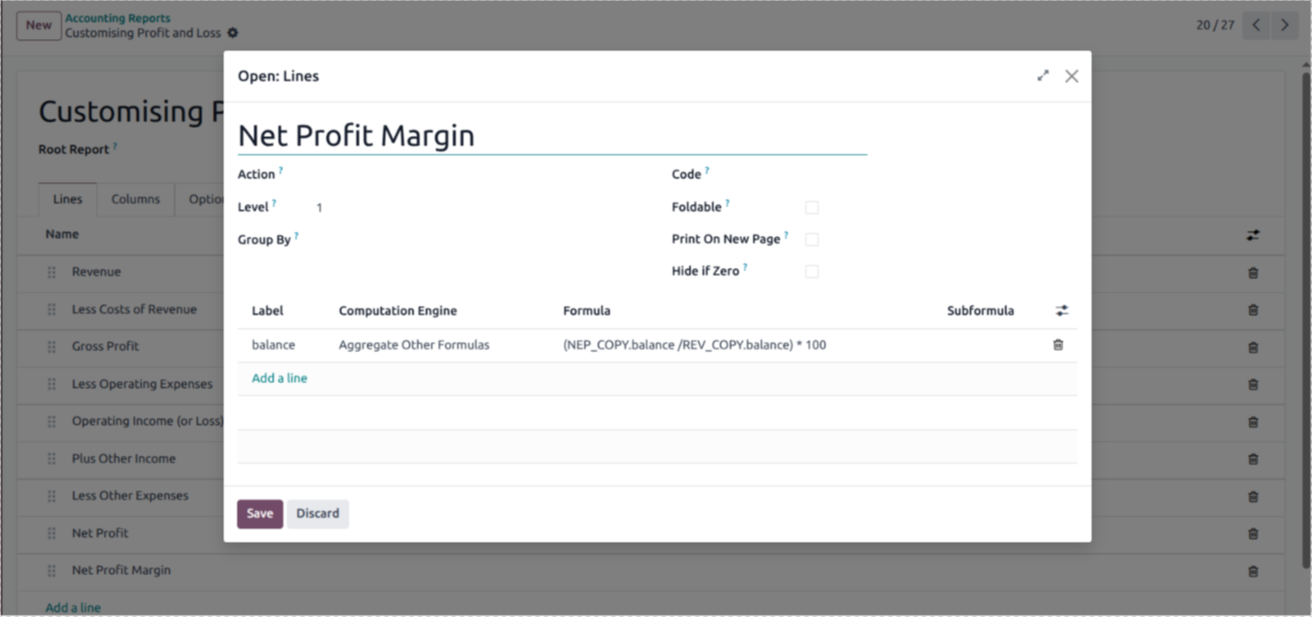
Easy-Peasy! As you can see in the image, we have used the Net profit code and the Revenue code from the above fields for creating formulas. This is how we learn- Adapt and Execute!
Conclusion
You just saw how easy it is to customize reports in Odoo. No coding, no heavy setup, just smart use of fields, a bit of math, and clear configurations. With the right approach, you can shape reports to match your business needs in minutes.
The beauty of Odoo report customization is that it transforms raw numbers into meaningful insights. At the end of the day, it’s not about how much data you have, but how clearly you can see the story it tells.
Remember: businesses are better with good technology, but they become great with smarter technology. A custom report layout in Odoo makes this transformation possible by turning complex data into clear, actionable insights.
If you’re ready to get the most out of Odoo and unlock deeper insights, connect with Surekha Technologies, we’re here to help.