“ELK” Stack is a collection of Three open source products of Elastic.
Elasticsearch is a distributed, JSON-based search and analytics engine designed for horizontal scalability, maximum reliability, and easy management.
Logstash is a dynamic data collection pipeline with an extensible plugin ecosystem and strong Elasticsearch synergy.
Kibana gives shape to your data and is the extensible user interface for configuring and managing all aspects of the Elastic Stack.
In this blog, I will explain how to monitor Liferay 7’s log by using ELK stack.
Prerequisite: Liferay 7.0 CE GA7 or Liferay 7.1 CE GA1 , Elasticsearch-6.x.x,Kibana-6.x.x,Logstash-6.x.x(ELK)
(Note: For configure ELK stack 6.x.x version with Liferay 7, The version of Liferay 7 must be GA7 or above.)
Download proper version of Elasticsearch, Kibana, Logstash
To configure Elasticsearch-6 with Liferay 7 follow this Liferay’s blog: link
Now, I believe we have configured liferay 7 with external Elasticsearch-6.
For monitor Liferay’s log By ELK follow below steps:
Configure Logstash with Liferay and Elasticsearch
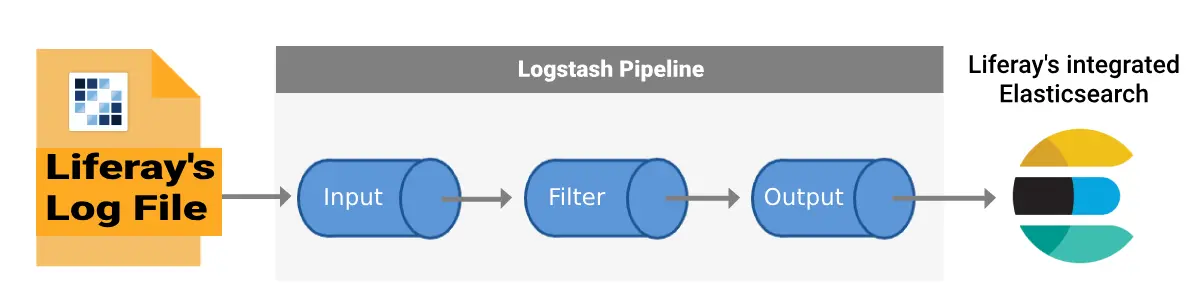
To configure Logstash with Liferay’s log and Elasticsearch we have to create following conf file in Logstash.
logstash-logs.conf
	input {
		file {
			path => "/home/st43/project/st/Blog/liferay-ce-portal-7.0-ga7/tomcat-8.0.32/logs/catalina.out"
			start_position => "beginning"
			codec => multiline {
			  patterns_dir => "/home/st43/project/st/Blog/ELK/logstash-6.3.0/patterns"
			  pattern => "(^%{TOMCAT_DATESTAMP})|(^%{CATALINA_DATESTAMP})"
			  negate => true
			  what => "previous"
			}
		}
	}
	filter {
		grok {
			patterns_dir => "/home/st43/project/st/Blog/logstash-6.3.0/pattern"
			match => [ "message", "%{TOMCAT_DATESTAMP:timestamp} %{LOGLEVEL:level} %{JAVALOGMESSAGE:logmessage}" ]
		}
		date {
			match => [ "timestamp", "yyyy-MM-dd HH:mm:ss,SSS Z", "MMM dd, yyyy HH:mm:ss a" ]
		}
		mutate {
			remove_field => ["timestamp","message"]
		}
	}
	output {
		elasticsearch {
			hosts => ["localhost:9200"]
		}
		stdout { codec => rubydebug }
	}
Setup Logstash’s conf, We need two elements input, output, and optional element filter
Input plugins consume data from a source.
Output plugins write the data to a destination.
Filter plugins modify the data as you specify.
1. Input configuration
I defined File inputs because I piped logs from a log file of tomcat servers into Logstash. As you can see below, input adds a "path" field that identifies the log file’s path start position every time “beginning”
The multiline codec is the key for Logstash to understand log events that span multiple lines. In my case, each Liferay log entry began with a timestamp, making the timestamp the best way to detect the beginning of an event. we are able to construct the multiline grok_ pattern to match both conversion patterns. The negate and previous mean that each line will log-line rolls into the “previous” lines unless the pattern is matched. (The patterns can be found in grok-patterns)
2. Filter Configuration
The grok filter is a key part of why this works with so little configuration. Grok is a way to match a line against a regular expression, map specific parts of the line into dedicated fields, and perform actions based on this mapping. I have used my own patterns which are declared in the grok-patterns file.
We have added date filter. This filter helps Logstash understand the exact time the event occurred.
We have added one more mutate filter. The mutate filter allows you to perform general mutations on fields. You can rename, remove, replace, and modify fields in your events.
3. Output Configuration
The output is simply an embedded Elasticsearch config as well as debugging to stdout.
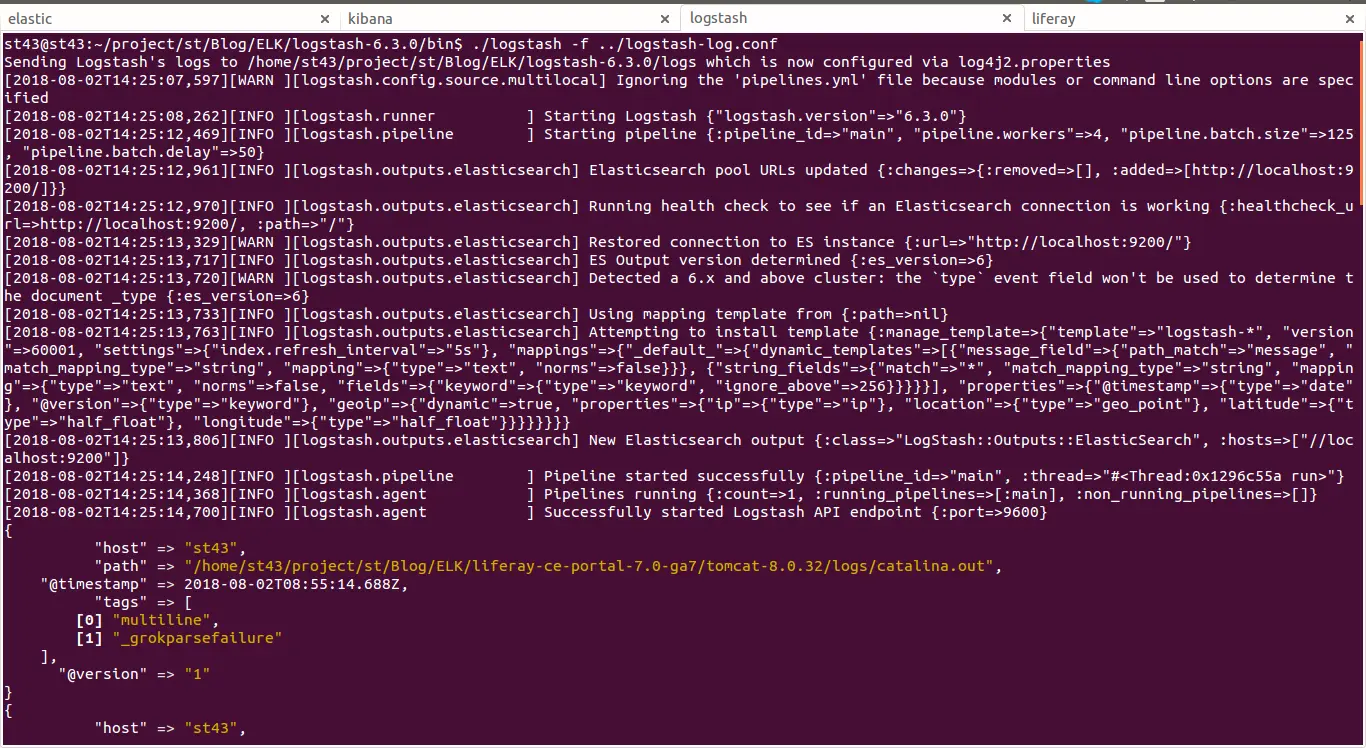
Now we can start Logstash with running this command in Logstash’s bin folder:./logstash -f ../logstash-log.conf
Configure Kibana to monitor different log level
Start Kibana by running this command in Kibana’s bin folder: ./kibana
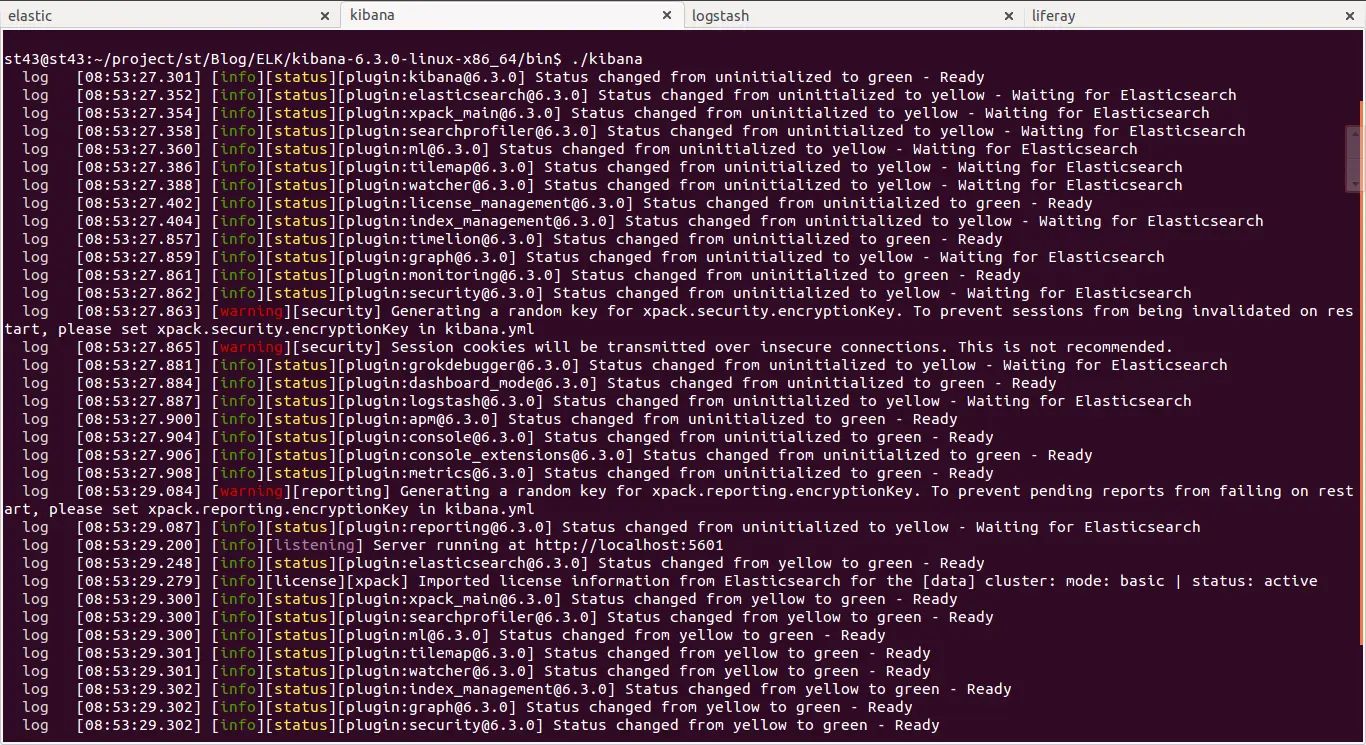
Note:- Elasticsearch must be started before starting Kibana
When kibana started open browser and hit localhost:5601
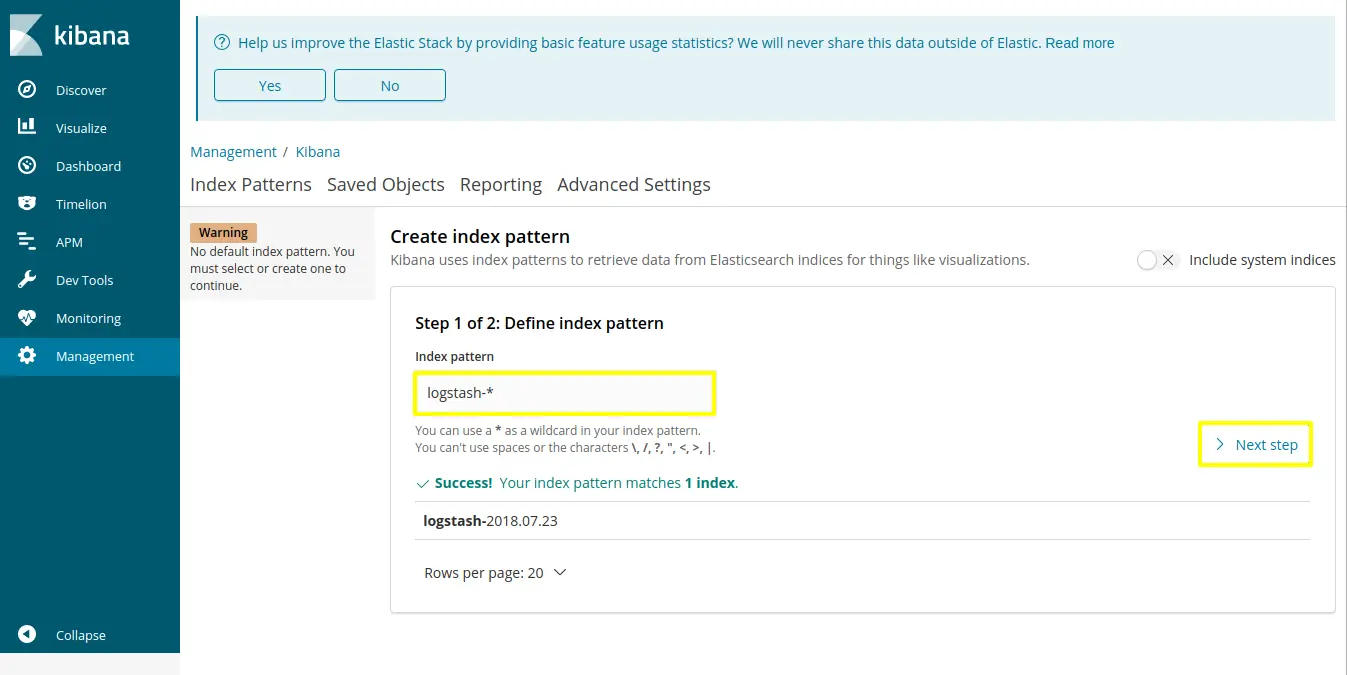
Click on “Management” which is on left side navigation tab and click on index patterns

Set index patterns as “logstash-*” and click on next step
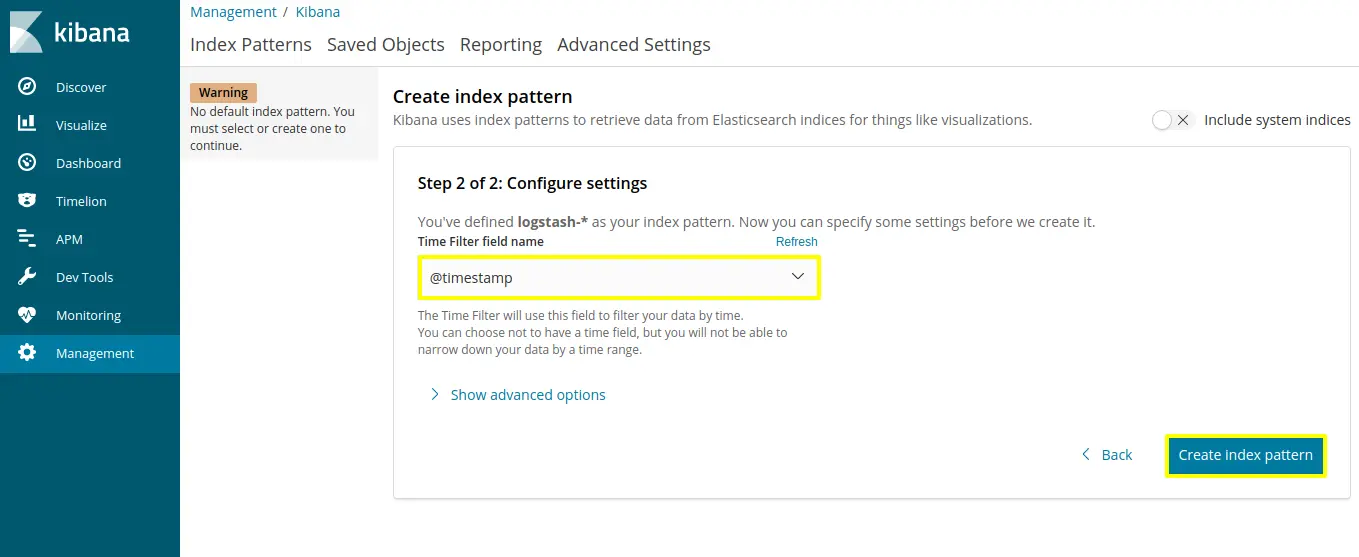
Select “@timestamp” in configure settings then click on “create index pattern”
We have created Index pattern, so now we are visualizing different log level in visualize section.
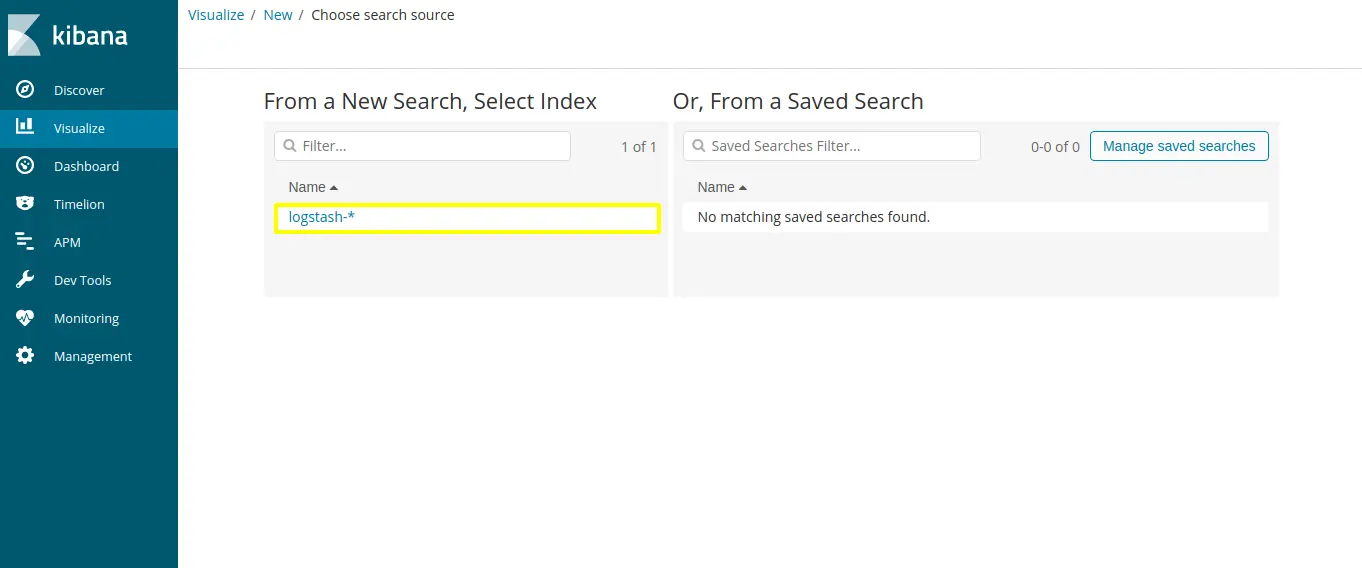
For that, click on visualize section of Kibana’s left side navigation menu and click on “create new visualize”
You would be able to see different type of chart selection in this blog I have selected vertical bar chart.
Now you would be able to see following screen
Select “logstash-*” which we have created Index pattern in kibana
For chart, “y-axis” is automatically selected as count so now configure “x-axis”
Select “Data histogram” in “Aggregation” field.
Set “field” as "@timestamp" and click on play button.
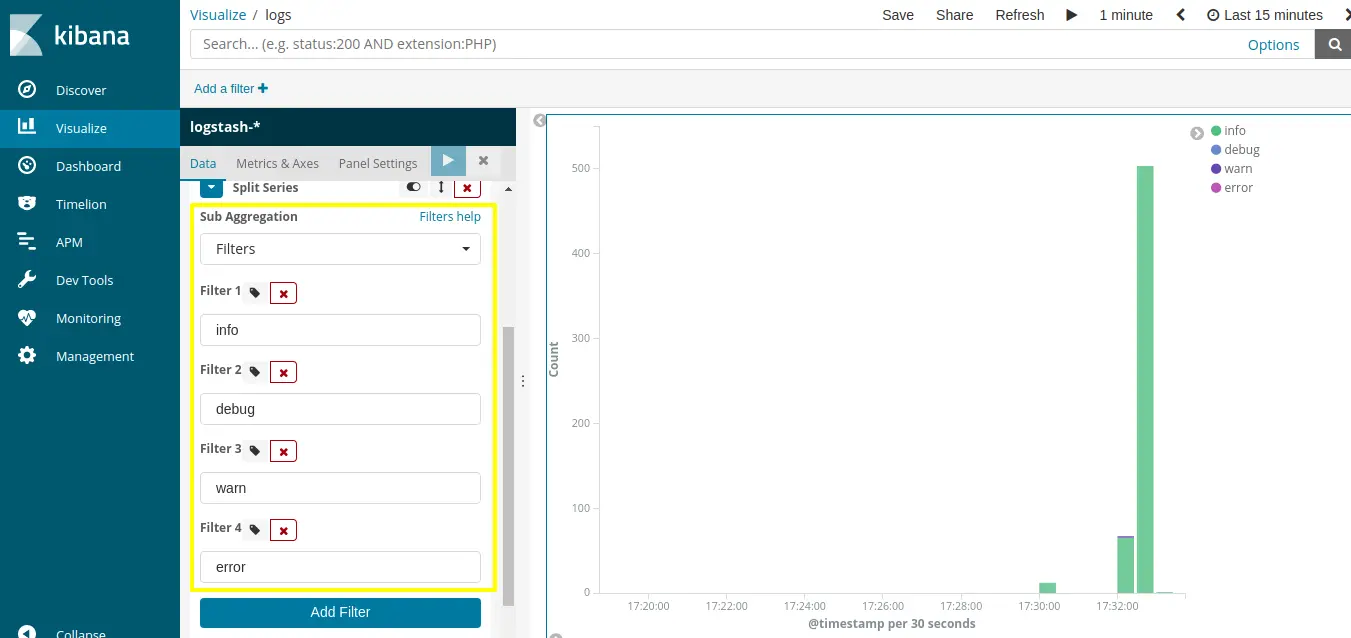
On “x-axis”, click on “add sub-buckets” which is used for merge different aggregation.
Select “Split series” in a sub-bucket list.
When you select “Split series”, we would be able to see “sub-aggregation” field in that we have select “filter” type and select following different filters save it.
Create a new dashboard on the dashboard page and add chart which we have created different log level chart in visualize section save it.
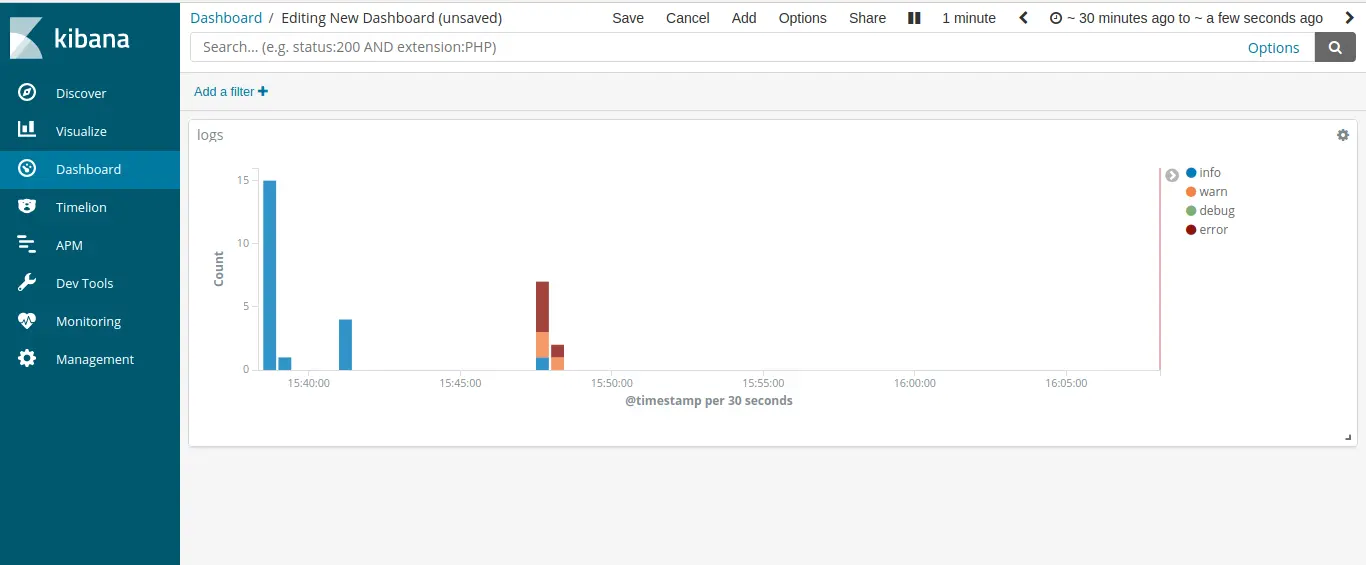
Now we are able to analyze and monitor different Liferay’s log by ELK Stack! We can also use different functionality of Kibana and Logstash to visualize better parameters of Liferay.