Introduction
Making the right decisions depends on using data effectively. Yet many companies still rely on spreadsheets and manual exports, which often create confusion, lose context, and reduce clarity when shared.
Odoo BI changes that. With smart spreadsheets and interactive dashboards all in one platform, Odoo 18 makes it easy for you to track performance, analyze data, and share insights. The results are faster decisions to be made, clearer reporting, and more confidence in your data.
Why Choose Odoo BI for Reporting?
Odoo BI (Business Intelligence) is not simply a reporting add-on but wholly integrated into the Odoo ecosystem. Odoo BI allows you to:
Important Advantages of Odoo Dashboards & Spreadsheets
Excel-style features – utilize formulas like SUM, AVERAGE, MATCH, VLOOKUP, etc.
Odoo Spreadsheets Advanced Reporting Made Simple
Beyond Traditional Excel Sheets
Unlike standard spreadsheets, Odoo spreadsheets are built directly inside the ERP system and connected to live business data. You no longer have to go through the cumbersome task of exporting your business data to a spreadsheet and/or keep multiple files open on your computer.
Key Capabilities of Odoo Spreadsheets
Pivot tables and conditional formatting for deeper analysis.
Guided Steps: Creating Reports using Odoo 18
From Pivot Tables to Dashboards:
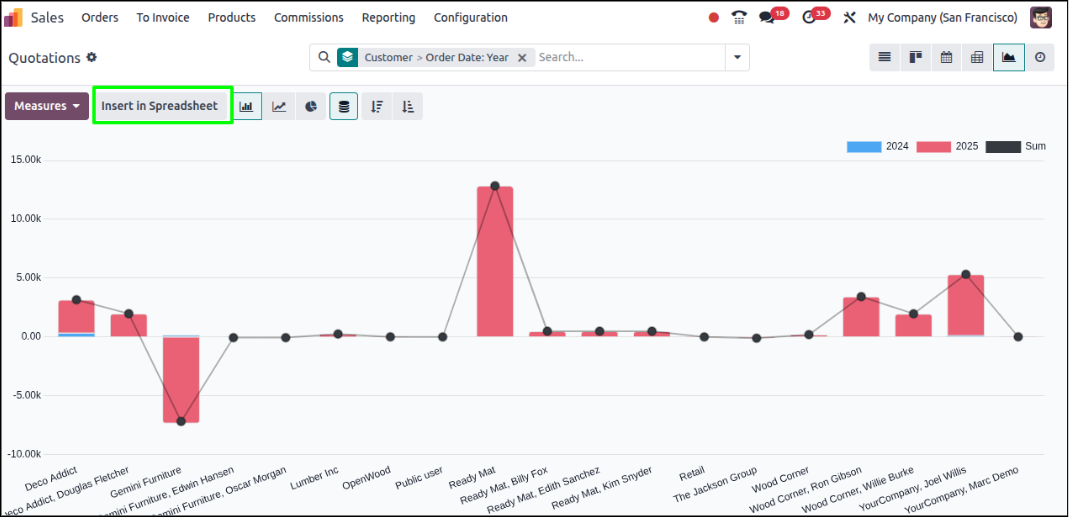
A Seamless Workflow Let's imagine you need to analyze your sales data in Odoo. You start by selecting your Sales Orders to create a Pivot Table. You drag and drop columns, expand rows and filter the data to view information pertinent to you.
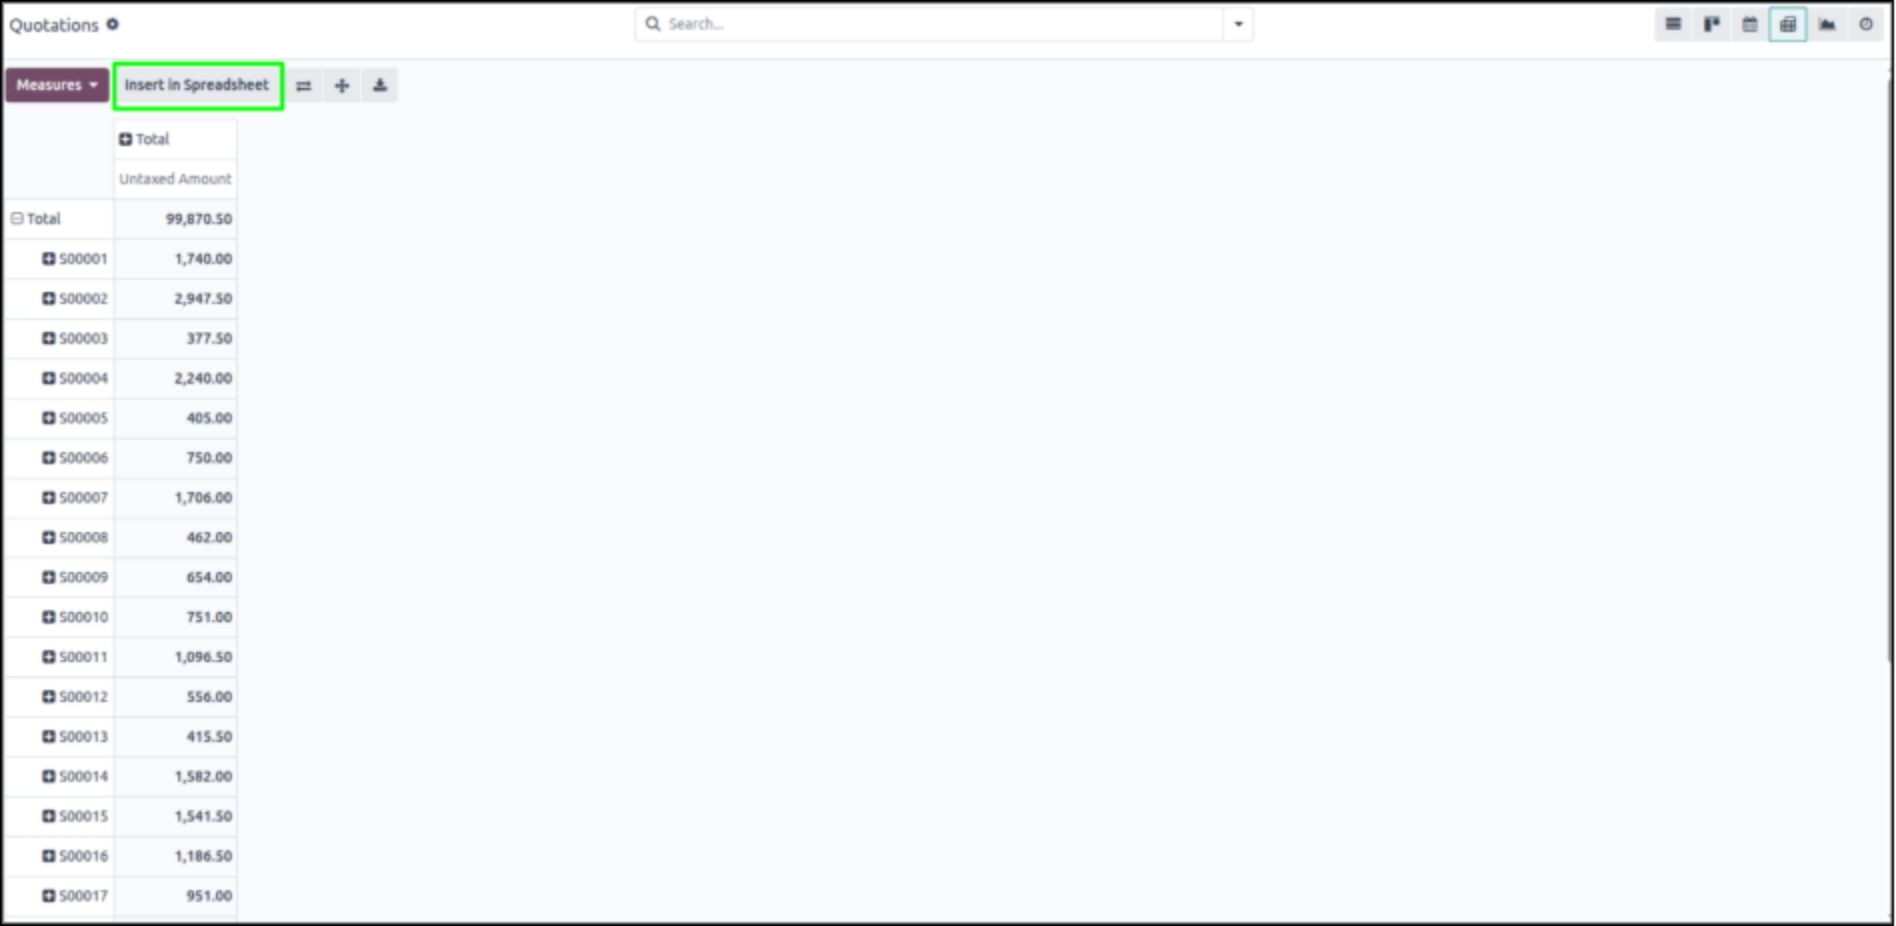
When the Pivot Table is ready, you click “Insert in Spreadsheet.” Odoo creates a live sheet, linked to the data you have in Odoo. There are no exports and no need to manually update the sheet; everything will be updated in real-time with the data provided by Odoo.
On the spreadsheet page, you'll be able to:
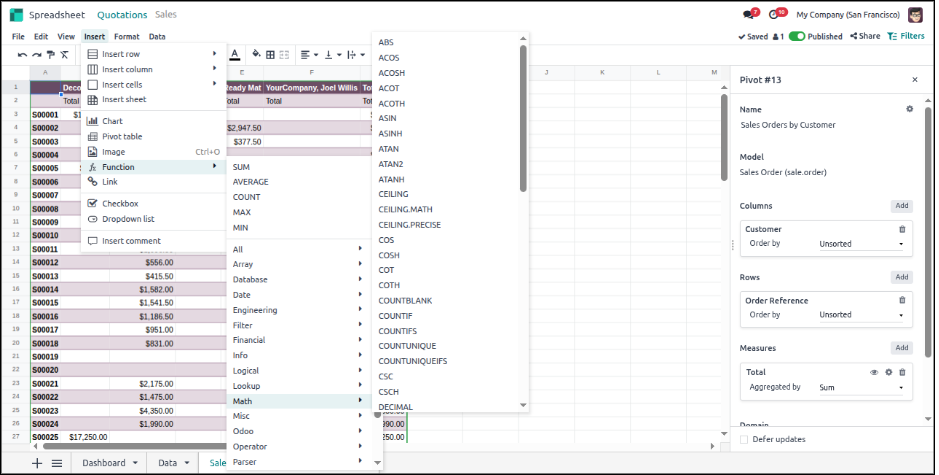
Apply formulas including SUM, AVERAGE, LOOKUP, MATCH, etc.
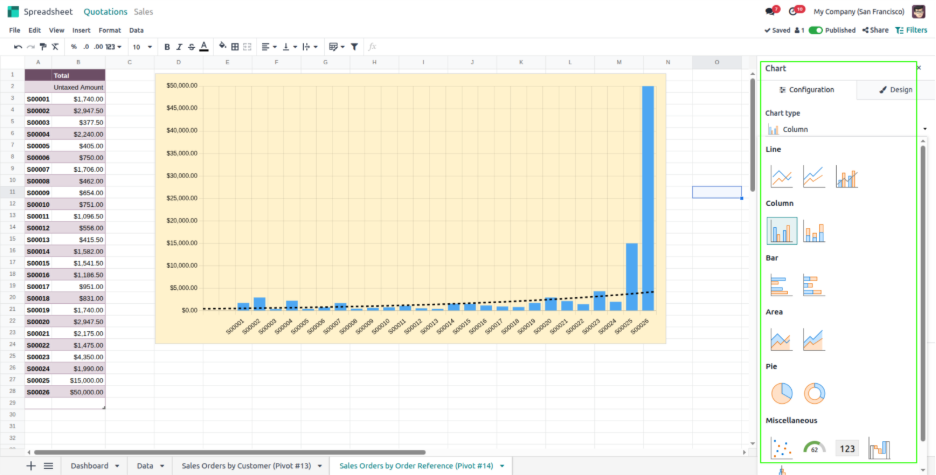
Visualization inputs
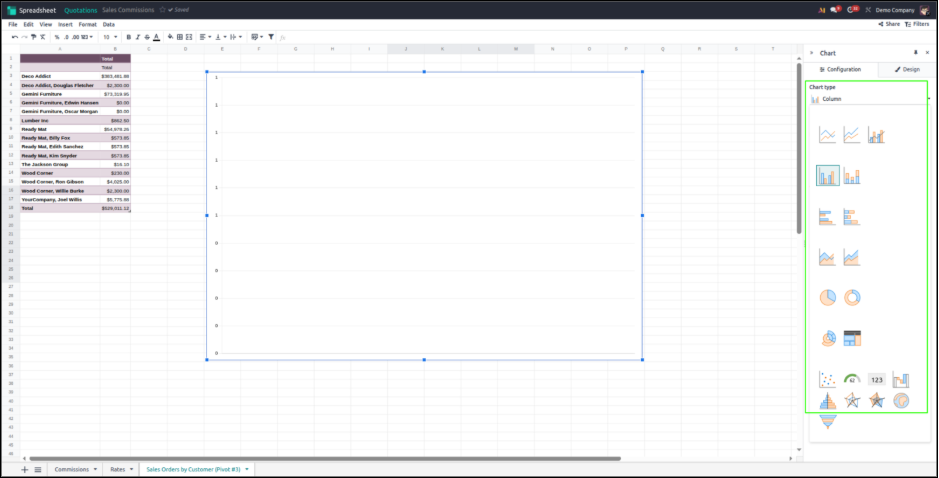
You can also insert charts and graphs from the spreadsheet to visualize the data in real-time, such as bar charts, line charts, pie charts, or pivot tables, etc.
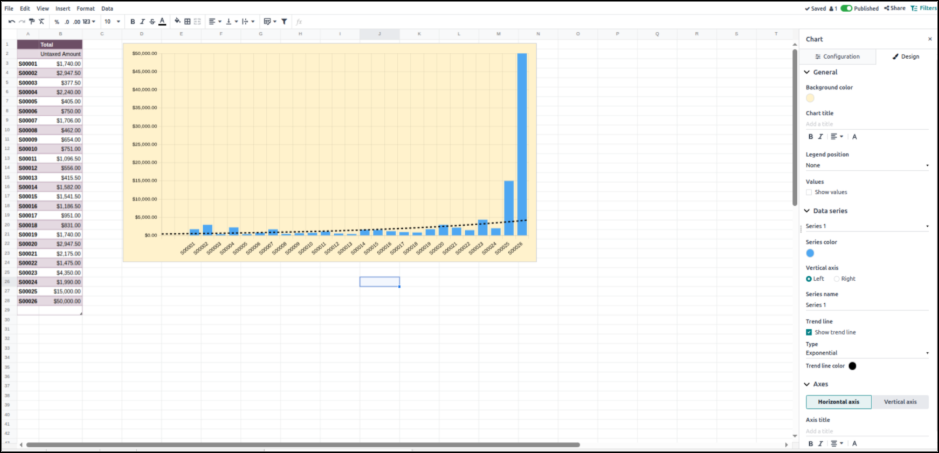
Modify Your Dashboard: Inside your spreadsheet, you can completely modify it to: Add charts and graphs directly in the spreadsheet. Add custom formulas for calculations or summarizations from your data. Add extra columns from other source(s), or existing data. Use the Data menu to add measures, row/column domains, or summarize values as totals, percentages, or other calculations.

Create Charts and Visualizations Make charts directly from the spreadsheet data, Odoo includes options for: - Different types of charts (bar, line, pie chart, etc.) - Customization options for design (colors, axis names, and trend lines).
Customizable Views for Every User
Dashboards are not universal. A sales manager might follow revenue compared to target, an accountant might follow overdue invoices, and a project manager might follow task status on their personalized dashboards.
Collaboration with Dashboards
Odoo dashboards can be shared with teams so that everyone is working off of the exact same live data. This keeps the departments aligned and makes sure that all decisions are based on accurate, live information.
Insert Any Graph View Into Your Spreadsheet to Build Real-Time Dashboards
With these features, you can create dashboards that combine running data and insights to your visualizations for ease of understanding trends, measuring performance, and sharing actionable reports with your colleagues.

Integrate Any Graph View Into Your Spreadsheet For Live Dashboards Odoo BI has another strong capability to take any Graph View from Odoo and turn it into a live spreadsheet for your dashboard. Here’s how it works:
Apply Filters or Domains Before inserting any graph into a spreadsheet, you can apply any filters or domains so that you will be inserting exactly what you want.
Again, your spreadsheet will only include the relevant information.
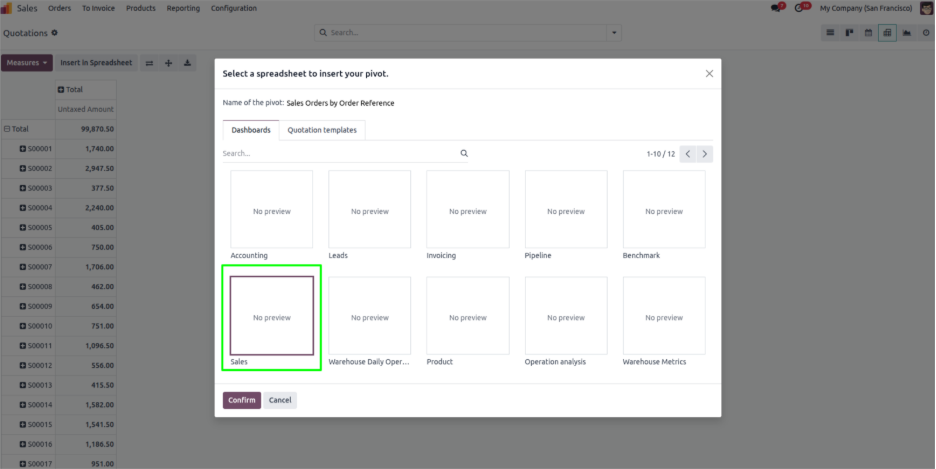
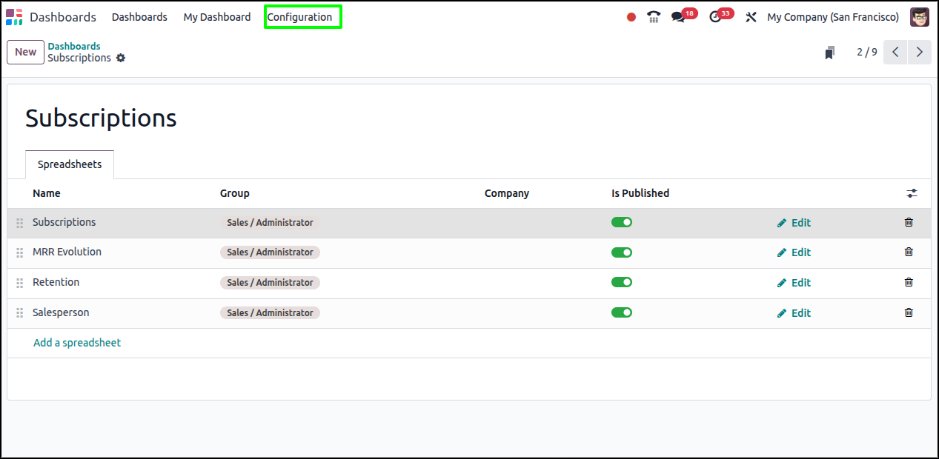
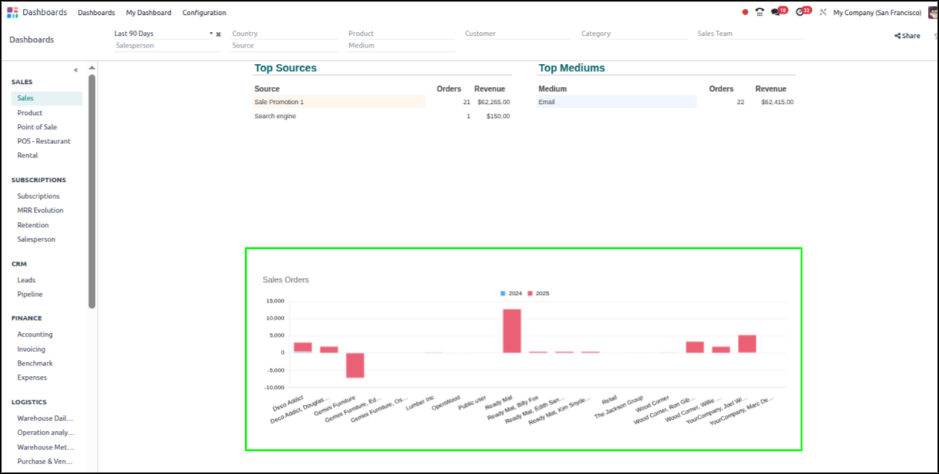
Insert into Spreadsheet When your graph view is ready, click “Insert in Spreadsheet.” Your data will appear in a spreadsheet that connects to your live Odoo database, without any exports. Select or Create a Dashboard Now, select a dashboard that you want, or create one.
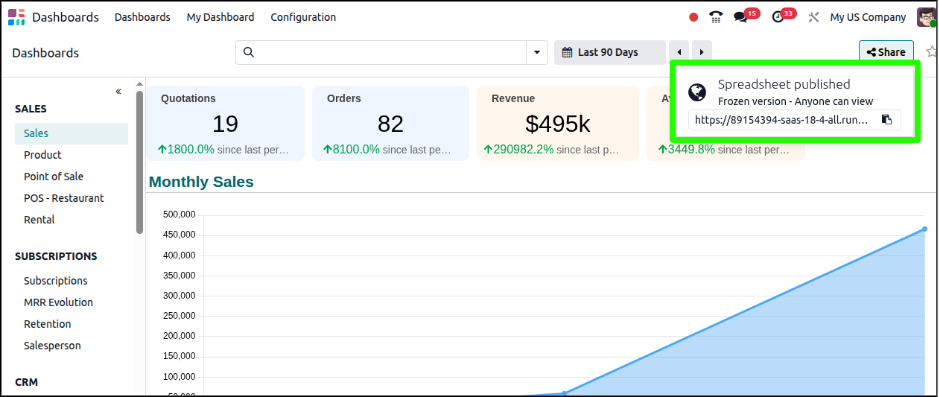
With your spreadsheet inserted into the dashboard, you will now have access to the dashboard, along with using other dashboards and tools that allows you to stay in one page and view multiple graphs and analysis.
Data is Live Because the spreadsheet itself is live, anything changes in Odoo (new sales, project updates, inventory updates), that data will show in your dashboard.
You can now see multiple reports simultaneously, without having to change from one menu to another.
This capability is very useful for any business that wants to gain access to multiple KPIs briefly and want real-time consolidated view.
Benefits of Odoo BI Reporting Tools
By combining dashboards and spreadsheets, Odoo BI provides several advantages:
Conclusion
Odoo BI significantly enhances reporting by going beyond a static spreadsheet and non-connected tools. With dashboards you can have a quick glimpse into its performance, with spreadsheets you can dive into the numbers. With Odoo BI you are able to see performance levels and act confidently. If you're looking for a simple, powerful and collaborative way to control your reporting, Odoo BI is the solution to bring it all together